Show options

Contents
The show options will be shortly described here. Most of the options are self explaining.

In order to have some insight in e.g. where bending moments find their cause the visualisation of the displaced pipeline might be of use. Because the displacements will be relatively small a magnification factor may be applied. The original position of the pipeline will remain as a vague shadow. displacedpipeline.png "Un-displaced pipeline") Un-displaced pipeline
displacedpipeline(sup).png "Displaced pipeline") Displaced pipeline
|
With a Steel-in-Steel pipeline the outer pipeline will hide the inner pipeline. In order to have a look to the inner pipeline the outer one can be hidden. The outer pipeline will remain vaguely visible.  Outer pipe hiding inner pipe
.png "Hidden outer pipe showing inner pipe") Hidden outer pipe showing inner pipe
|
Having displayed idents, constraints or connections on the pipeline one might want to know which nodes are assigned to them. Checking this box the node numbers will be displayed also.  Showing idents
.png "Showing idents with accompanying node numbers") Showing idents with accompanying node numbers
|
Before using the (optional) Soil model wizard it might be wise to check the entered Ground and Water levels. A simple representation of the levels will be displayed. 
|
Under development.
|
Using this view the effect of the settlements on the displaced pipeline can be seen. 
|
Selecting this option all entered polygon points from the POLYDIF table will be shown, together with the polygon lines. 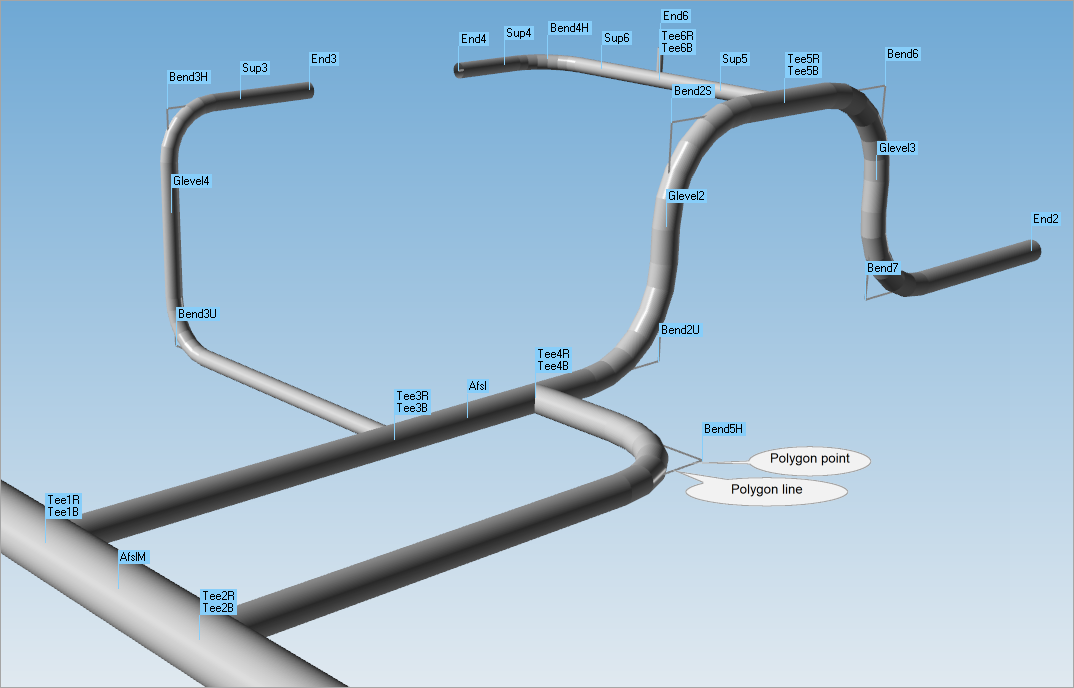 As the polygon lines are positioned on the pipe axis they only will be visible at bends where the polygon points are outside the actual pipeline. Weak elements are polygon lines as well, but they are not made visible here. A separate checkbox can be selected to show the weaks.
|
Selecting this option the tangent lines of the bends are shown as red lines. 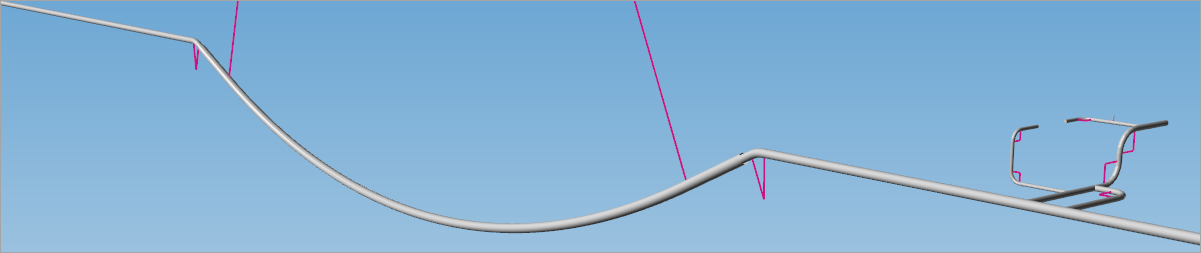
|
Selecting this option all idents will be displayed. These are idents defined in the POLYDIF table as well as additional idents from the ADIDENT table as well as idents generated by the program. 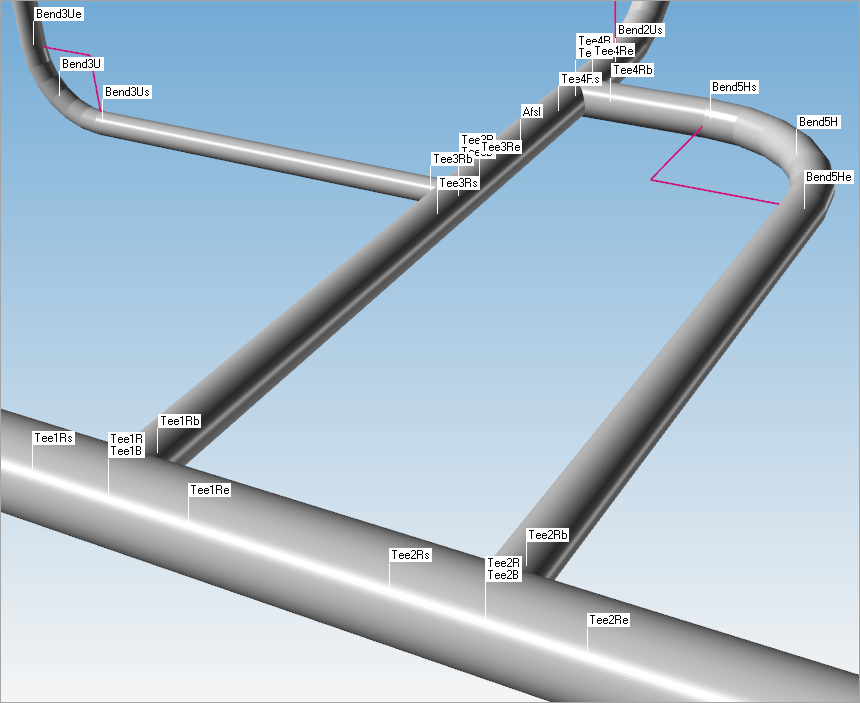
|
Selecting this option all nodal point loads, end points and supports will be displayed. 
|
Selecting this option all connections will be displayed. 
|
Selecting this option the elastic bend elements will be indicated. 
|
Selecting this option the weak elements will be shown as 4 light blue lines.  The path of the polygon lines is indicated by the numbered arrows.
|
With a relatively long pipeline drawn with the actual diameter, the pipeline might hardly be visible. In order to have a clear view the centreline of the pipeline can be drawn. 
|
The visualisation is displayed in perspective view by default. However, for precise assessments, such as verifying if lines are parallel or perpendicular, the orthographic view provides more accurate information.  Perspective view Orthographic view The following views are available: •Perspective view: This view simulates how our eyes see the world, with objects appearing smaller as they get farther away. It gives a realistic sense of depth, making it easier to visualise a 3D scene. Think of looking down a long hallway—the walls seem to converge in the distance. •Orthogonal (Orthographic) view: This view flattens depth, so all lines stay parallel and objects don’t appear to get smaller with distance. It’s great for seeing the true shape and size of each part without any perspective distortion. •Isometric view: This is a type of 3D view where the object is rotated so you can see multiple sides at once (usually front, top, and side). It doesn’t show depth the way perspective does, but it gives a clear, balanced view of the object's structure.
|
When a certain view will be used more times, e.g. to get equal pictures in a report, there is the possibility to save the current viewport. 
When later on another picture has to be made the saved viewport can be loaded again. This can be done from the primary database as well as from the secondary database.
|
The current view can be printed directly via the normal print dialog box. The view can also be exported to file (PNG or WMF) or exported (copied) to the clipboard. A pasted picture from the clipboard may look like this: 
|
Common_functionality_Examples (last modified: Nov 28, 2025)
See also:
Graphical representation of the configuration